Some of the numbers presented in this website may not be the most recent available
globalshift.co.uk - copyright © 2009 to 2026; All rights reserved


Oil and Gas Histories and Forecasts
Production | Wells | Reserves | Charts
Click a region at the top of page or here for all


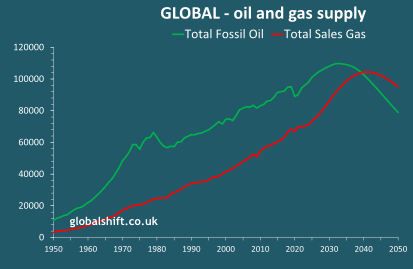
Oil production
Field (conventional) oils
Natural gas liquids
Shale/tight oil & oil sands
Manufactured oils
Cumulative and remaining
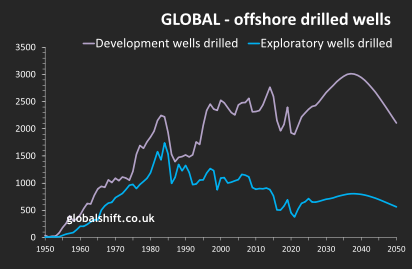
Drilled wells
Exploratory (E & A) wells
Development (D) wells
Gas production
Sales (conventional) gases
Shale/tight gases
CBMs and CMMs
Cumulative and remaining
Water depths
0 to 500 metres
500 to 1000 metres
1000 to 2000 metres
greater than 2000 metres


The Energy Shift
- is a slow phase-out of oil and gas (and coal)
The world burns through 16 billion tonnes of fossil fuels each year, in the process emitting double that weight of carbon dioxide into the atmosphere.
These emissions can only be curbed, and they need to be curbed, if we de-carbonise energy sources by reducing the use of fossil fuels and/or capturing the carbon.
However, our living standards absolutely depend on abundant energy supplies while alternative cleaner energies are [currently] more costly, take time to develop, and often require scarce raw materials.
With oil and gas still providing 60% of the global energy mix, humans continue to depend on fossil fuels for transport, electricity, food and materials. And we will depend on them for years to come - even as carbon-free, more sustainable supplies grow.
A shift to cleaner energy is thus an extraordinary challenge. More than ever companies and governments need realistic, comprehensive and detailed oil and gas forecasts from an independent, unbiased source in order to plan for, and respond to, the [necessary] Energy Shift.
globalshift.co.uk is one such source. And it is free.

PRODUCTION MAXIMA (forecast in Nov 2025)
Oil (000s bbls per day)
Sales Gas (bcm per year)
Type
On (Conventional)
Off (to 500m)
Off (to 1000m)
Off (to 2000m)
Off (>2000m)
All (Conventional)*
Natural Gas Liquids
Oil Sands
Shale and Tight oil
All Fossil Oils
All Oils**
Year
1979
2004
2041
2032
2040
2016*
2041
2032
2029
2035
2037***
Vol.
52,169
21,780
2,535
7,558
5,161
74,424
19,545
4,837
9,961
106,353
118,787
Type
On (Conventional)
Off (to 500m)
Off (to 1000m)
Off (to 2000m)
Off (>2000m)
All (Conventional)*
CBM gas
Shale and Tight gas
All Fossil Gases
Year
2008
2039
2041
2041
2043
2040*
>2050
2047
2041***
Vol.
1,847
1,382
251
424
257
4,070
267 (2050)
1,535
5,814
* Includes fossil oil or gas extracted by traditional methods. The year is the supply peak.
** Includes all fossil oils plus manufactured oils.
*** The year is a price-dependent demand peak.
Summary Production Numbers: